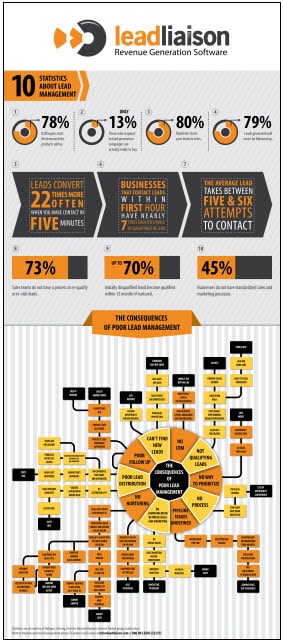
The Consequences of Poor Lead Management
 Infographics are an easy, eye-catching way to discuss issues in today’s B2B environment. We recognize how helpful infographics can be in developing a lead management strategy. So we’ve produced a colorful, extensive lead management chart, which should help small to mid-size companies struggling with how they should manage their lead generation process. We call it, The Consequences of Poor Lead Management.
Often, infographics are built on statistics. Statistics provide reference points as to what industry players are doing and the results from their activities. That is why we’ve built this infographic on 10 major statistics that are referenced within the revenue generation industry.
The infographic breaks down the most quoted lead management statistics available:
- % of buyers who research purchases online
- % of marketing leads not passed to sales
- % of leads that will never be followed up
- % of sales teams with no process to re-qualify leads
- Likelihood of leads converting if contacted within five minutes of a query
- Average number of attempts required to make contact with a lead
- % of marketing campaign respondents who are ready to buy immediately
- Likelihood of lead qualification if contacted within one hour of a query
- % of companies with no standardized sales and marketing processes
- % of leads initially disqualified that buy within 12 months
The infographic flow chart displays ten consequences of poor lead management. Within each consequence there are extensions which highlight 2 to 17 effects of a poor lead management strategy. From every set of effects there is an outcome that results from each specific issue. This adds up to over 70 details about the consequences of poor lead management!
The infographic is intended to assist small to mid-size companies in addressing their lead management process. Lead Liaison executives hope that, by providing this information in an easy-to-follow format, the infographic can be used as a tool for boosting lead management effectiveness. By adressing the issues detailed in this free chart, companies can improve revenue generation.
The chart may be downloaded and printed so executives can easily reference the details. Check out the lead management infographic today and contact Lead Liaison for ways to improve your lead management process.
Download this infographic.


